매니지드 K8S가 아닌 자체 관리형 K8S에서의 Prometheus + Grafana 구축 방법
UI 접근을 위한 외부 통신으로 MetalLB+HAproxy+Nginx Controller가 구성 되었다는 전제 하에 구축
CSP 환경이라면 Ingress 설정에서 AWS ALB Controller와 같은 로드밸런서를 사용해 훨씬 간편하게 구축 가능
- Prometheus 공식문서: https://prometheus.io/docs/prometheus/latest/installation/
- Grafana 공식문서: https://grafana.com/docs/grafana/latest/setup-grafana/installation/
개요
kube-prometheus-stack helm chart 구조
1
2
3
4
5
6
7
8
kube-prometheus-stack ├── Prometheus Operator (핵심 엔진) ├── Prometheus 인스턴스 ├── Grafana (시각화 대시보드) ├── AlertManager (알람 관리) ├── Node Exporter (Node 매트릭 수집) ├── kube-state-metrics (K8S 리소스 매트릭 수집) └── 기본 ServiceMonitors/PrometheusRules (정책)
Prometheus Operator란
- CRD 기반 Prometheus 관리 도구
- Prometheus, ServiceMonitor, PrometheusRule 등의 Custom Resource 제공
- 선언적 방식으로 Prometheus 설정 관리
Prometheus + Grafana 설치
helm 리포지토리 추가
1
2
3
helm repo add prometheus-community https://prometheus-community.github.io/helm-charts helm repo add grafana https://grafana.github.io/helm-charts helm repo updatekube-prometheus-stack 설치
- prometheus + grafana 합쳐진 패키지
- values.yaml 수정
1helm show values prometheus-community/kube-prometheus-stack > values.yaml- grafana pvc 설정
1
2
3
4
5
6
7
persistence: enabled: true type: sts storageClassName: "longhorn" accessModes: - ReadWriteOnce size: 5Gi- prometheus pvc 설정
- selector: {} 삭제
- longhorn은 selector 지원하지 않음
- selector: {} 삭제
1
2
3
4
5
6
7
8
storageSpec: volumeClaimTemplate: spec: storageClassName: longhorn accessModes: ["ReadWriteOnce"] resources: requests: storage: 40Gi- alertmanager pvc 설정
- selector: {} 삭제
- longhorn은 selector 지원하지 않음
- selector: {} 삭제
1
2
3
4
5
6
7
8
storage: volumeClaimTemplate: spec: storageClassName: longhorn accessModes: ["ReadWriteOnce"] resources: requests: storage: 2Gi- kube-prometheus-stack 설치
1helm install prometheus prometheus-community/kube-prometheus-stack -f values.yaml --namespace monitoring --create-namespace
Grafana UI 접근
ingress 생성
- 8082포트를 사용하는 grafana service로 연결
 1
 2
 3
 4
 5
 6
 7
 8
 9
10
11
12
13
14
15
16
17
18
19
20
21
22
23
24
25
cat <<EOF > grafana-ingress.yaml apiVersion: networking.k8s.io/v1 kind: Ingress metadata: name: grafana-ingress namespace: monitoring annotations: nginx.ingress.kubernetes.io/backend-protocol: "HTTP" nginx.ingress.kubernetes.io/proxy-body-size: "50m" spec: ingressClassName: nginx rules: - host: "grafana.<도메인>" http: paths: - path: / pathType: Prefix backend: service: name: prometheus-grafana port: number: 80 EOF kubectl -n monitoring apply -f grafana-ingress.yamlHAproxy 설정
ingress를 조회하여 MetalLB로부터 부여받은 IP 확인
- 현재는 172.27.1.100
1
2
3
4
# kubectl get ingress -n monitoring # kubectl get ingress -n monitoring NAME CLASS HOSTS ADDRESS PORTS AGE grafana-ingress nginx grafana.<도메인> 172.27.1.100 80 9s확인한 IP를 HAproxy 설정에 추가
- HAproxy 서버 공인 IP로 접근 시 grafana의 Ingress로 통신되도록 설정
1
2
3
vim /etc/haproxy/haproxy.cfg haproxy -c -f /etc/haproxy/haproxy.cfg systemctl reload haproxy1 2 3 4 5 6 7 8 9 10 11 12 13 14frontend unified_frontend_8080 bind *:8080 mode http option forwardfor http-request set-header X-Forwarded-Host %[req.hdr(host)] http-request set-header X-Forwarded-Proto http http-request set-header X-Forwarded-Port %[dst_port] # Host 기반 라우팅 use_backend metallb_backend_grafana if { hdr(host) -m sub grafana } backend metallb_backend_grafana server grafana 172.27.1.100:80
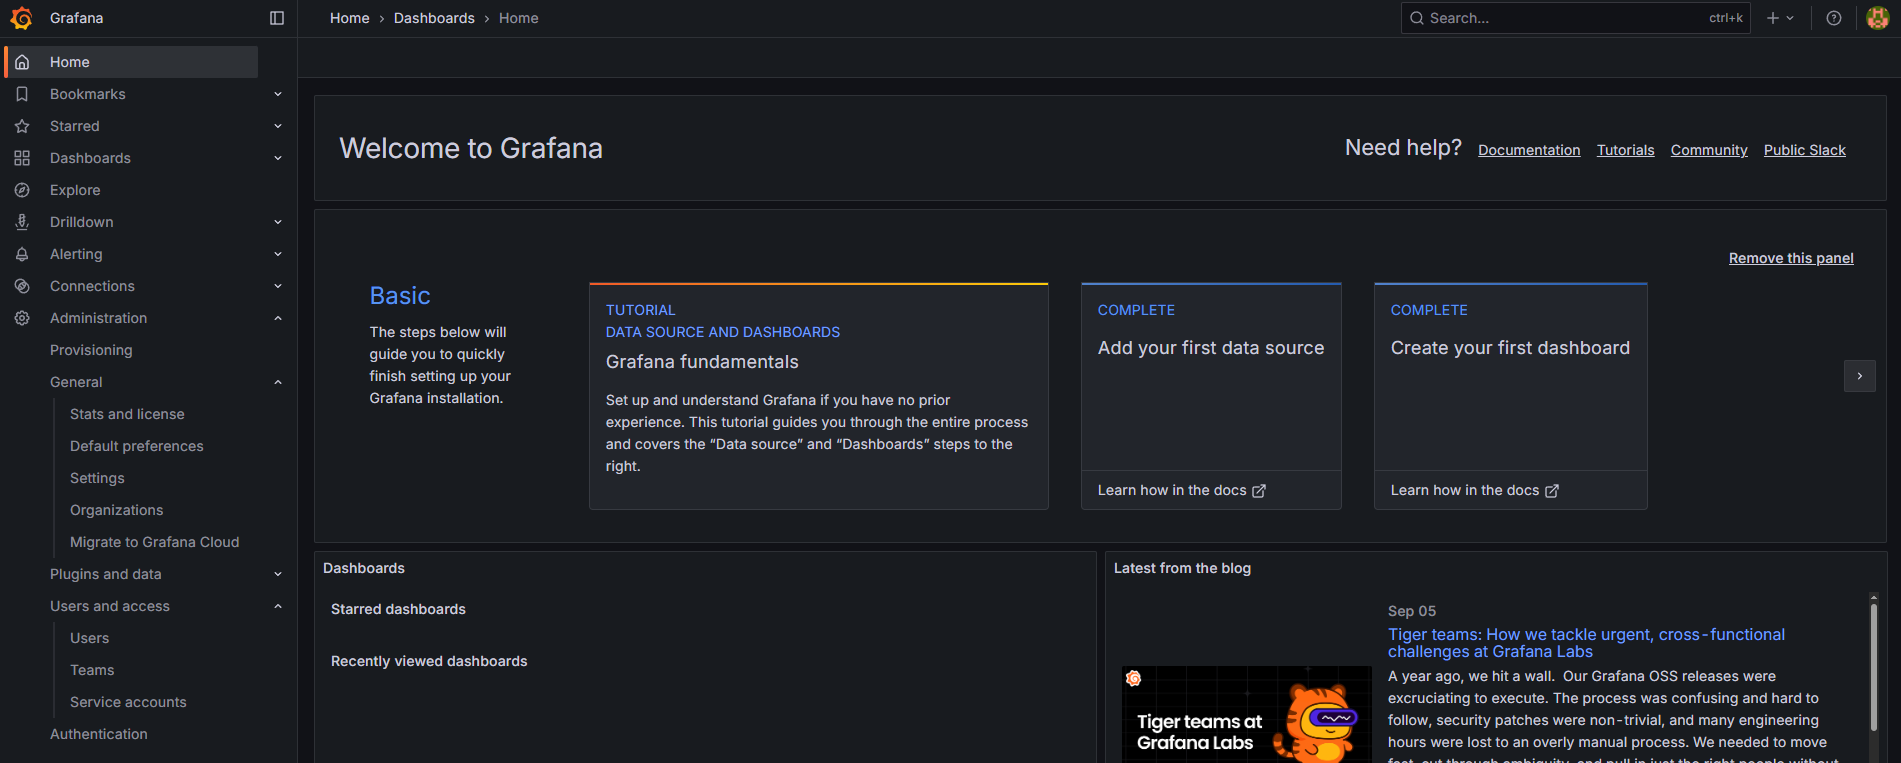
접근 성공!
Grafana 관리자 비밀번호 확인
1kubectl --namespace monitoring get secrets prometheus-grafana -o jsonpath="{.data.admin-password}" | base64 -d ; echo
대시보드 그래프 origin not allowed 에러 발생 시
- IP주소로의 직접 접근을 Grafana의 CSRF 정책이 요청 차단
도메인을 통해 접근해서 CSRF 정책 통과
- ingrass, haproxy에 설정되어있던
grafana.local을 새로 설정한도메인으로 변경 - values.yaml 수정
1 2 3 4 5 6 7 8 9 10 11 12 13grafana: ... adminPassword: <GRAFANA_PASSWORD> grafana.ini: server: domain: <도메인>:48082 root_url: http://<도메인>:48082 security: csrf_trusted_origins: "<도메인>:48082" csrf_cookies_secure: false cookie_secure: false cookie_samesite: lax ...설정 반영
1 2 3 4helm uninstall prometheus --namespace monitoring kubectl --namespace monitoring delete pvc --all helm install prometheus prometheus-community/kube-prometheus-stack -f values.yaml --namespace monitoring
- ingrass, haproxy에 설정되어있던
Prometheus UI 접근
ingress 생성
- 8080포트를 사용하는 prometheus service로 연결
1 2 3 4 5 6 7 8 9 10 11 12 13 14 15 16 17 18 19 20 21 22 23 24 25cat <<EOF > prometheus-ingress.yaml apiVersion: networking.k8s.io/v1 kind: Ingress metadata: name: prometheus-ingress namespace: monitoring annotations: nginx.ingress.kubernetes.io/backend-protocol: "HTTP" nginx.ingress.kubernetes.io/proxy-body-size: "50m" spec: ingressClassName: nginx rules: - host: "prometheus.local" http: paths: - path: / pathType: Prefix backend: service: name: prometheus-kube-prometheus-prometheus port: number: 9090 EOF kubectl -n monitoring apply -f prometheus-ingress.yamlHAproxy 설정
ingress를 조회하여 MetalLB로부터 부여받은 IP 확인
- 현재는 172.27.1.100
1
2
3
# kubectl get ingress -n monitoring NAME CLASS HOSTS ADDRESS PORTS AGE prometheus-ingress nginx prometheus.<도메인> 172.27.1.100 80 9s확인한 IP를 HAproxy 설정에 추가
- HAproxy 서버 공인 IP로 접근 시 prometheus의 Ingress로 통신되도록 설정
1
2
3
vim /etc/haproxy/haproxy.cfg haproxy -c -f /etc/haproxy/haproxy.cfg systemctl reload haproxy1 2 3 4 5 6 7 8 9 10 11 12 13 14frontend unified_frontend_8080 bind *:8080 mode http option forwardfor http-request set-header X-Forwarded-Host %[req.hdr(host)] http-request set-header X-Forwarded-Proto http http-request set-header X-Forwarded-Port %[dst_port] # Host 기반 라우팅 use_backend metallb_backend_prometheus if { hdr(host) -m sub prometheus } backend metallb_backend_prometheus server prometheus 172.27.1.100:80
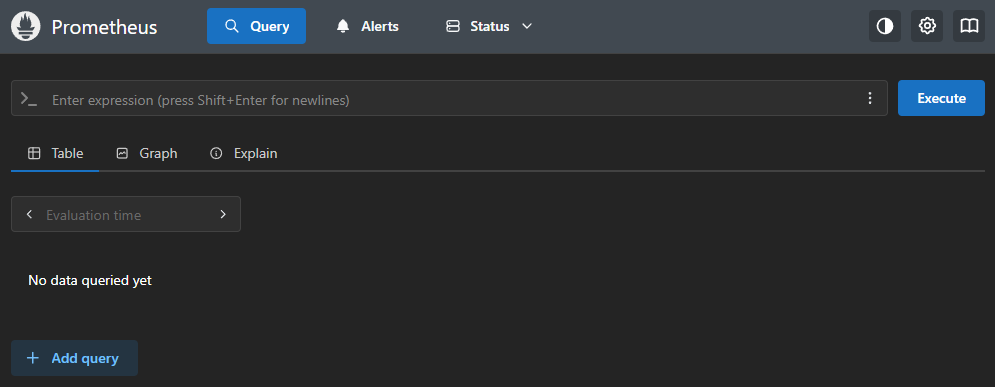
접근 성공!